Power BI Report: Analyzing LapCat vs LapDog Performance at Waggle

An interactive Power BI report that visualizes product performance and user data for Waggle.
In this project, I analyzed user and pet data from Waggle, a pet-tech startup known for its innovative smart devices for pets. After the success of the LapDog fitness collar for dogs, Waggle launched a field test of its feline counterpart called “LapCat”. My report aims to help stakeholders understand how the new device is performing and whether it justifies further development.
Datasets Overview
The data used in this project was provided by Udacity as part of their Data Analyst Nanodegree Program. The datasets were already cleaned and curated to simulate real-world business scenarios, allowing me to focus on analysis, visualization, and stakeholder communication.
Data Model
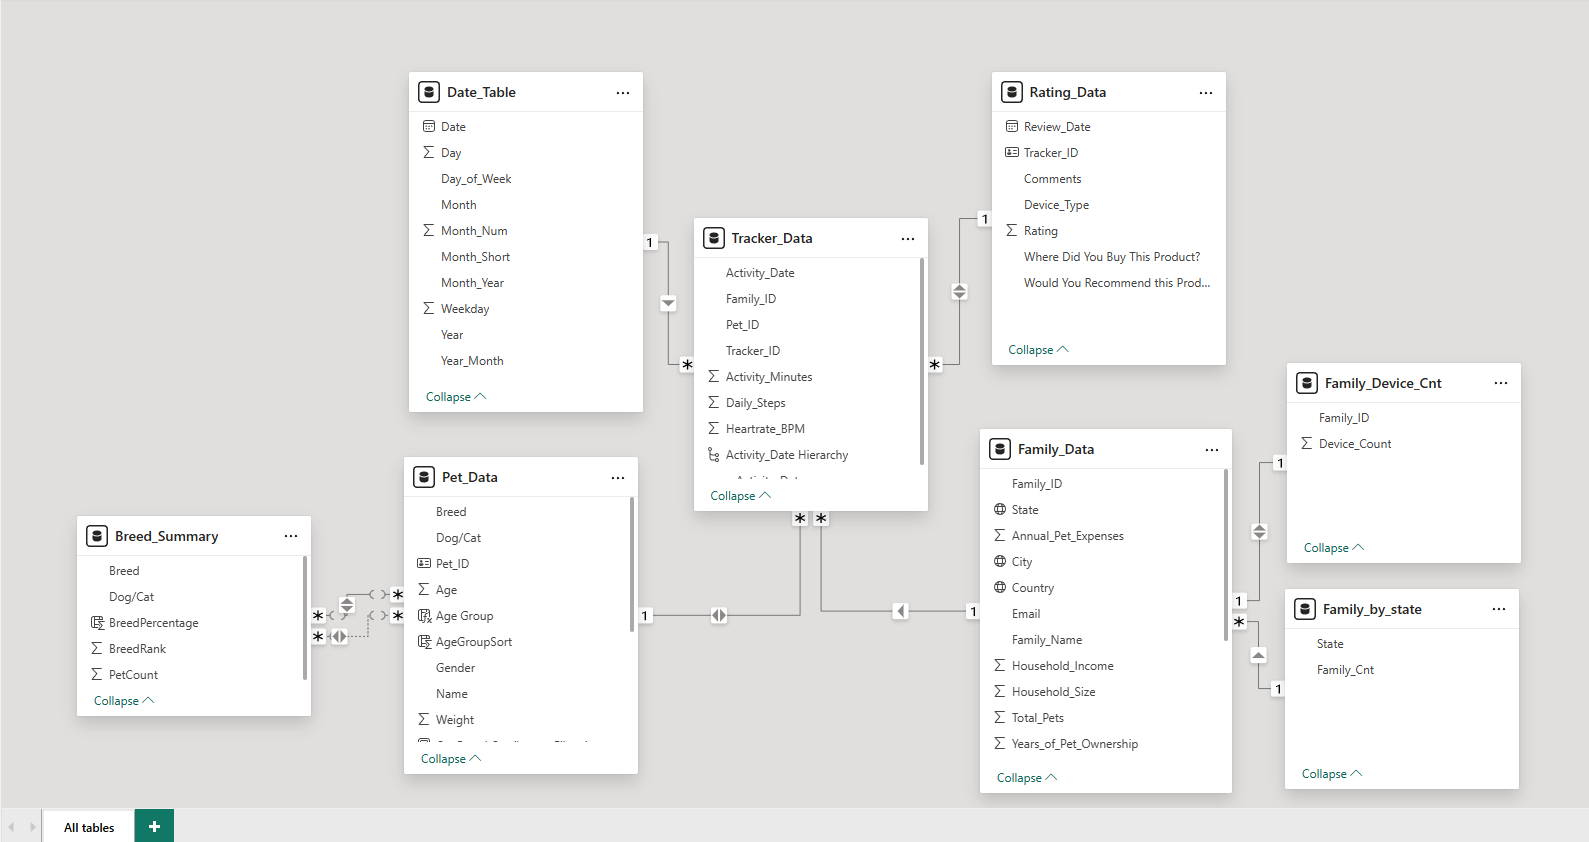
Business Requirements
Waggle stakeholders posed strategic questions to evaluate LapCat’s market performance and user reception:
From the CEO:
- Did average daily steps increase for cats wearing the LapCat, as they did for dogs with the LapDog?
- Were LapCat users as satisfied with the product as LapDog users?
From the Product Team:
- What demographic insights can we uncover about Waggle families and their pets?
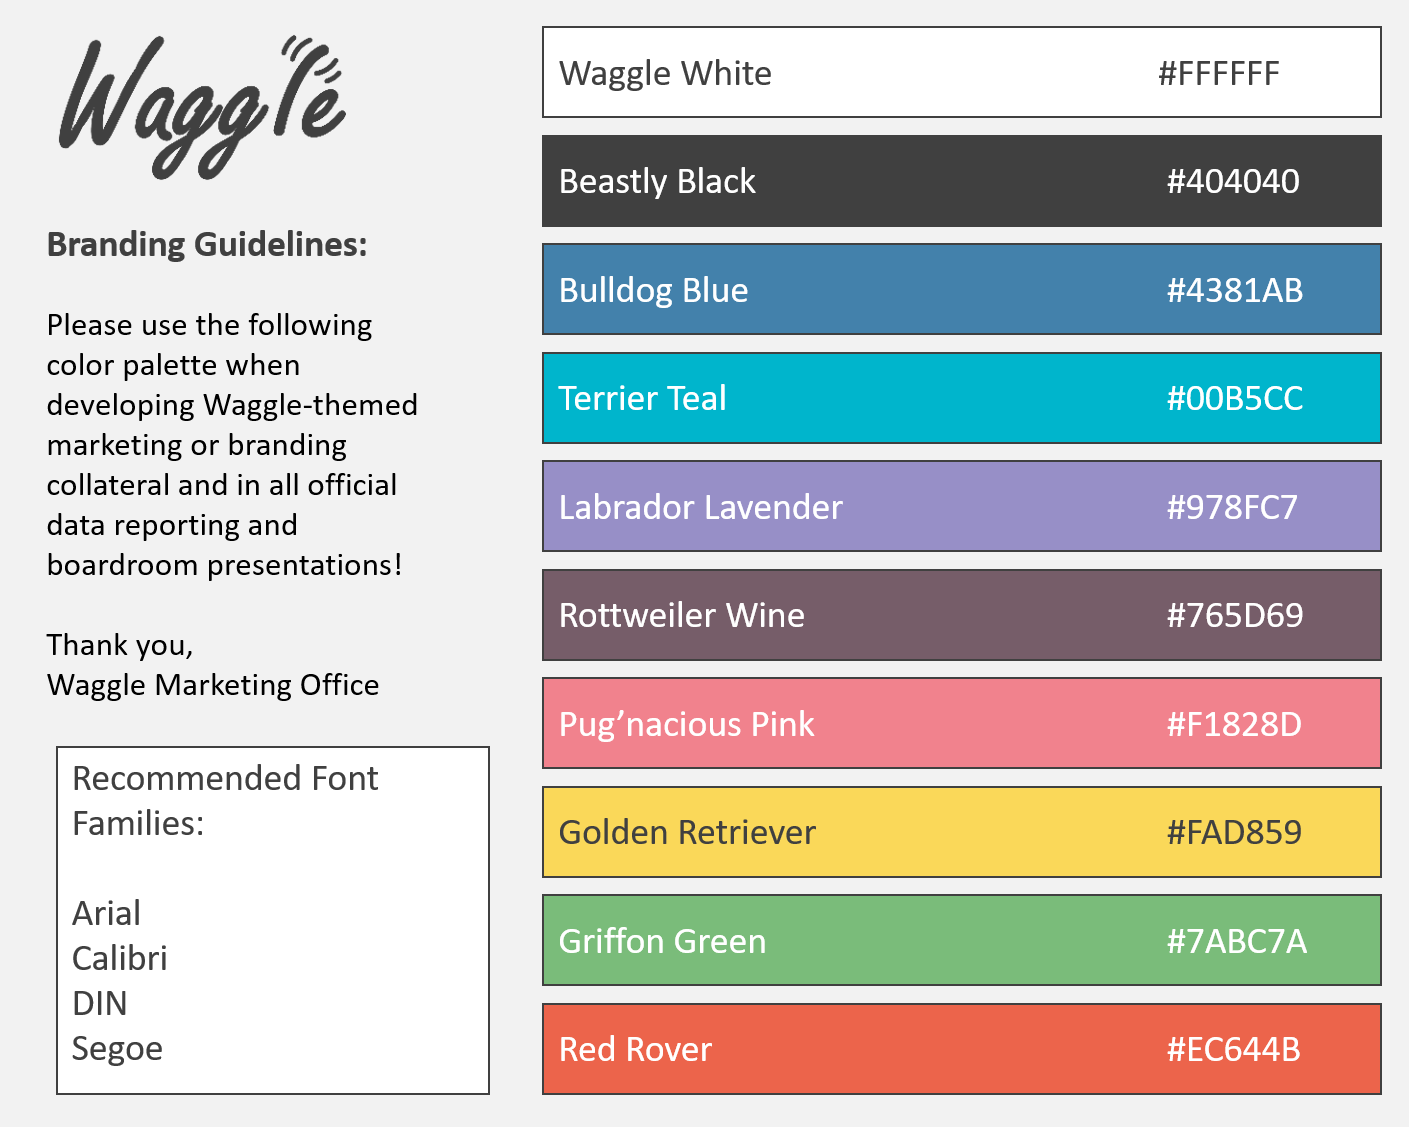
Design & Usability Requirements: The report also needed to meet Waggle’s design standards:
- A branded header on each page, showing the page title and Waggle logo
- Slicers positioned on the left or beneath the banner to filter visuals
- Navigation buttons placed consistently for ease of use
- Only Waggle-approved palette colors (plus black, white, and gray tones)
- One reset button per page to clear filters
- Buttons for page-to-page navigation
The Report
Explore the Interactive Report
Demo Video
Report Layout Overview
The Power BI report contains four interactive pages, with consistent navigation and styling. Key interface elements include a slicer panel, reset filters button, and page-specific navigation—all wrapped in Waggle’s visual identity.
Page 1: LapDog vs LapCat (Home)
This page directly addresses the CEO’s questions with side-by-side compareisons:
- Average daily step count and satisfaction ratings by device
- Step trends over time by species
- Activity minutes and daily steps by month/year
Page 2: Pets Summary
- Demographics of Waggle pets: species, breed, age, weight.
- Activity breakdown: steps and active minutes by pet age and weight
Page 3: Family Summary
- Owner location, household size, and income demographics.
- Visuals show patterns in household types and pet ownership.
Page 4: Family Details (Drill-Through)
- This is a detailed view of individual households and their pets. This page is accessed by right-clicking entries from the table visual on Page 3.
- Supports deeper insights into user-level data.
Key Features
- Waggle-branded theme and layout for consistency
- Dynamic visual swapping for comparing trends
- Filter reset and drill-through functionality
- Built-in slicers for stakeholder exploration
- Used the same colors for dogs and cats across all pages to make comparisons easy and intuitive.
Key Findings
LapDog vs LapCat Performance
-
Activity Impact: LapDog devices led to a significant increase in average daily steps for dogs, while LapCat devices showed a decrease in feline activity. In 2020, dogs wearing the LapDog averaged 14,667 steps per day, compared to only 2,765 steps for cats.
-
User Satisfaction: LapDog received an average rating of 4.69 stars, with 85.65% of users giving a perfect 5/5. In contrast, LapCat scored an average of 1.64 stars, with 36.02% of users rating it just 1/5. This suggests widespread dissatisfaction with the LapCat experience.
Pets Summary
-
Population & Breed Distribution: The dataset includes 10,161 dogs across 19 breeds, and 1,000 cats across 13 breeds. The most common dog breed is the Golden Retriever; for cats, it’s the American Shorthair.
-
Age & Weight Trends:
- Dogs are most commonly age 6, while cat ages are more evenly spread between 5–12 years. Heavier, mid-aged dogs (50–100 lbs, ages 3–10) exhibit the highest activity minutes. Interestingly, average daily steps among all dog age groups follow the same upward trend, from ~8,000 to ~15,000 steps over time.
- Cat activity minutes remain relatively flat across all weight classes. Younger cats (under 3 years) have the least activity time, under 3,000 minutes, while older cats average between 3,000 and 10,000 minutes. Step count patterns are inconsistent and show no clear upward trend across cat age groups.
Family Summary
- Key Averages:
- Average household income: $523,312
- Average household size: 2.99
- Average annual pet expenses: $7,883
- Location & Purchase Behavior:
- The majority of customers are located in California.
- Waggle.com is the most common purchase channel.
- Household Composition: 54.56% of households own three pets, with fairly even household size distribution.
Final Thoughts
This Power BI project for Waggle was a valuable opportunity for me to focus on data modeling, stakeholder communication, and interactive dashboard design.
While branding and layout help engage stakeholders and make the report approachable, my top priority was always data accuracy and delivering practical, business-relevant insights. A visually polished report earns attention, but clear, correct, and useful insights are what drive decisions.